FREEZE: Climate Data Explorer


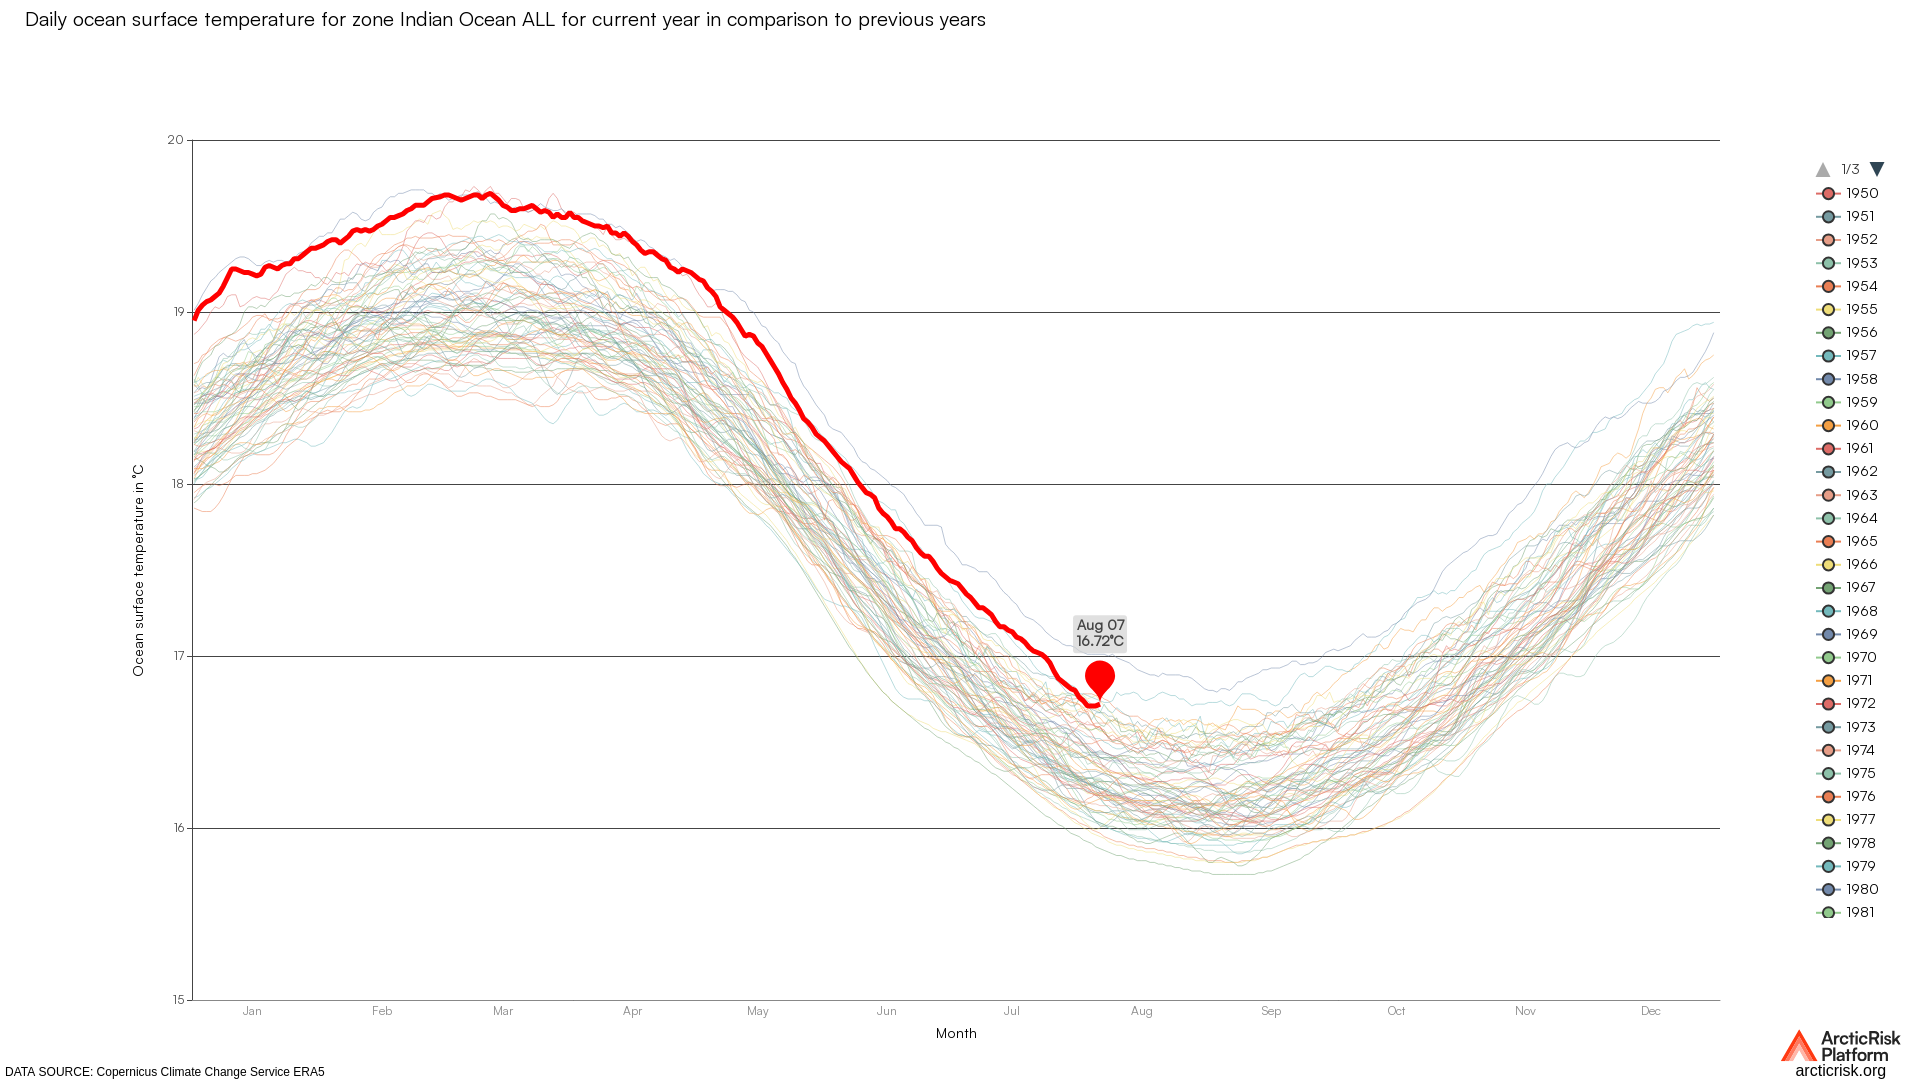
Daily of 2m surface temperature across various latitudnal zones over the years.Derived from dataset made available by ECMWF; Dataset :Daily…

Daily of 2m surface temperature across various latitudnal zones over the years.Derived from dataset made available by ECMWF; Dataset :Daily…


Global Surface Air Temperature (GSAT) anomalies (°C) relative to 1850-1900 based on CMIP6 model simulations. This data is basedon IPCC AR6…


Daily of 2m surface temperature across various latitudnal zones over the years.Derived from dataset made available by ECMWF; Dataset :Daily…